

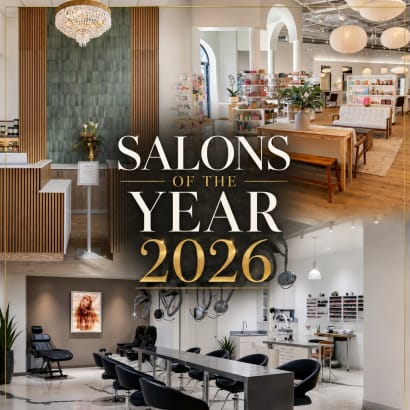
Got a Gorgeous New Business? SALONS OF THE YEAR Application Now Open!
The landmark, photo-based interior design competition has opened its application process. We'd love you to hit us with your best shots!
by Stacey Soble
Before exploring the individual profiles of the 2019 SALON TODAY 200 honorees, we look at the collective narrative their data tells us about the professional salon industry.
Before exploring the individual profiles of the 2019 SALON TODAY 200 honorees, we look at the collective narrative their data tells us about the professional salon industry.
A few decades ago, a well-known stylist could hang a shingle on the door and quickly grow a successful salon business with little effort, but those days are long over. To write a successful beauty story in today’s world, salon and spa owners must be:
Tenacious in order to navigate a constant sea of industry disruptions.
Committed to building a strong culture that attracts both talent and clients.
Flexible and willing to change systems with the turbulent times.
Quick-witted to strategize future management shifts, hire and train the best talent for the future, design clever promotions that drive in new business and motivate teams with engaging practices.
Willing to embrace data and adopt technology tools that streamline their business practices.
Self-aware and determined to overcome their limitations as they strive to be the best possible leader.
Confident and able to empower their team members for a better business.
Open to sharing their successful ideas with others and able to ask for help.
And, talented enough to be able to juggle the frequent challenges that owning a business throws their way.
Sound exhausting? It can be, but it also can be remarkably rewarding to build a salon and spa business that can enact change within a community, create fruitful careers for a team of talented professionals and bring a smile to the faces of clients day in and day out.
Each year, the SALON TODAY 200 shares the stories of the most successful salons and spas in North America, helping their owner peers by sharing both their numbers and their bright ideas. Before we spotlight each profile, let’s take a look at what this year’s collective data tells us about the state of the salon industry.
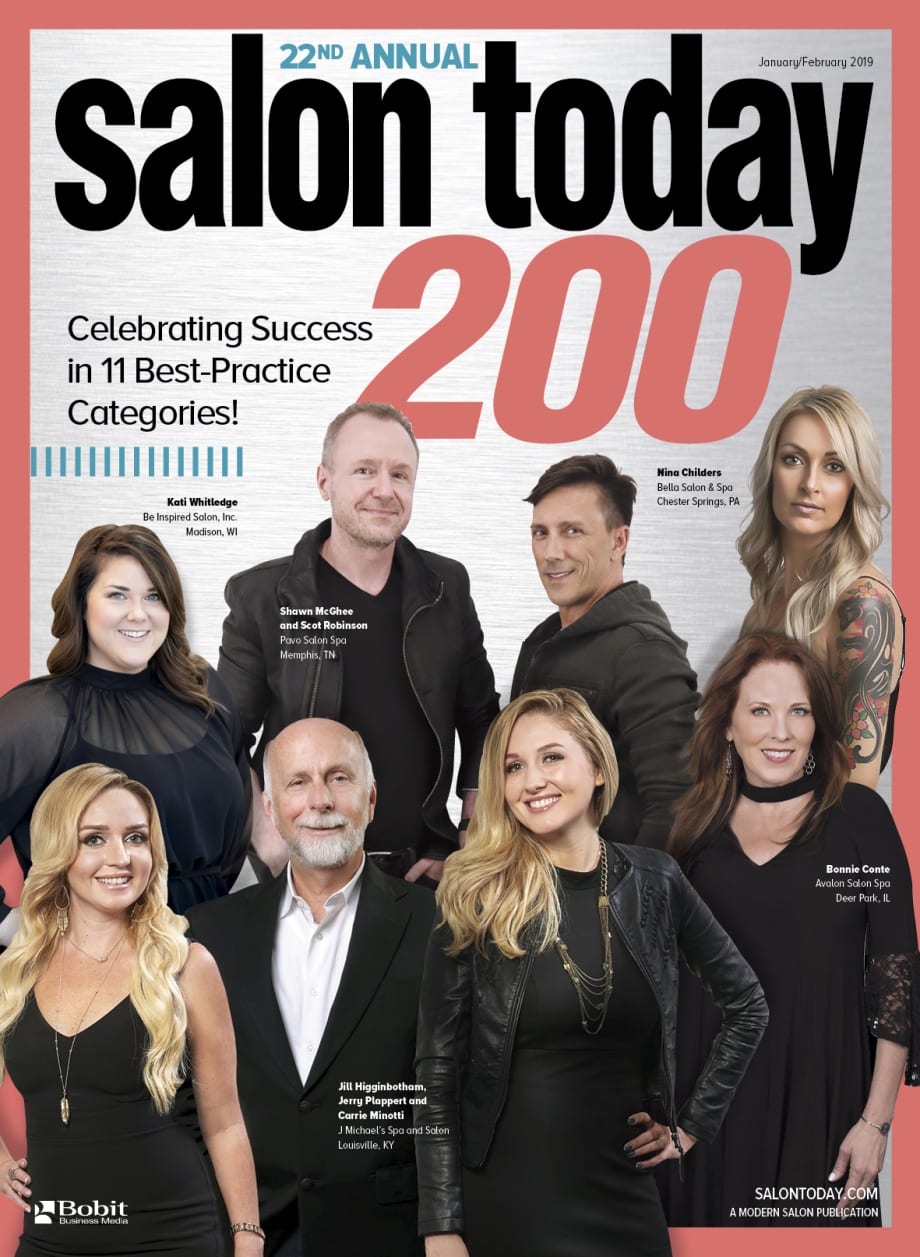
CLASS OF 2019:
THE OVERALL NARRATIVE
While the bulk of the overall coverage of the 2019 SALON TODAY 200 focuses on the individual profi les and pearls of wisdom from this year’s honorees, an analysis of their data as a collective group illustrates the overall professional beauty industry in a moment in time.
In calendar year 2017, the overall ST200 brought in total gross sales of $334,253,800. Th at means, on average, this year’s honorees rang up $1,671,269 in service and product sales in 2017. As a group, the ST200 grew their revenue from 2016 to 2017 by 15%, the same steady growth rate as last year’s class. Collectively, these salons rung up 4,057,298 client tickets last year.
In late summer 2018, applications representing states across the U.S. flooded our offices, with a handful (2%) hailing from Canada. After judging was complete, the South tallied 40% of the honorees, with the Midwest claiming 29%; the West counting 16%; the Northeast representing 13%, and again, Canada rounding it out with 2%.
To be able to enter the 2019 SALON TODAY 200, salons and spas had to generate annual service and product sales revenues of at least $250,000 since 2016. After meeting that threshold, the ST200 represents salons of all sizes, with 7% accruing 2017 sales of $250,000 to $499,999; 36% earning be-tween $500,000 and $999,999; 35% tallying $1,000,000 to $1,999,999 and 22% bringing in totals of $2,000,000 or more. More than half (57%) of the 2019 ST200 honorees earned gross revenues of $1 million or more.
Although many statistics from the ST200 go up and down year to year, the breakdown of expenditures remains relatively unchanged. It continues to remain an important guideline for owners to measure their own P&L statements against. Labor costs continue to top the list, representing on average 48% of the salon’s budget, followed by supply costs (11%); rent/mortgage (7%); profi t (7%); taxes (5%); owner compensa-tion (4%); marketing/advertising (3%); education/training (3%); employee benefi ts (2%); utilities (2%); insurance (2%); professional services (2%) and telecommunications (2%).
When it comes to the rev-enue streams in the salon, hair color and cutting services con-tinue to be the largest growing categories among the ST200, with color services representing 38% of gross revenue and cut-ting services capturing 30%. Making up the rest of the gross revenue is retail sales (16%); skin care/body care/spa services (6%); chemical service sales (4%) and nail services (2%).
THE CHARACTER OF A ST200 HONOREE
By examining the collective data from all the ST200 honorees, we are able to sketch what salon success looks like. The average ST200 salon and spa:
• Launched their salon dream by opening their business in 2007. The majority are relatively younger businesses, with 63% opening since 2005. The longer a salon has been open though, the greater the likelihood of having higher revenue levels.
• Operates one location. Three in four ST200 honorees have only one location. Of those that have more than one location, they operate on average three sites.
• Leases their space. While 80%of the honorees lease their space, the number of salons/spas owning their space (16% this year) has continued to grow each year.
• Occupies an average of 4,223 square feet. This number is down 7% from last year, as salons and spas strive to create more efficient spaces.
• Considers themselves a salon and spa. At 99%, almost all of the 2019 honorees define themselves as a salon and spa business.
• Seeks business advice. Last year, 55% of the ST200 say they have consulted a business coach—that number has grown steadily since 2013.
• Networks with peers. At 67%, most ST200 honorees report being members of one association or more. Th e Professional Beauty Association, Intercoiffure, 2 to 10, Cosmetologists Chicago, Green Circle and Summit Salons are popular choices.
• Tallies $1 million in sales or more. ST200 honorees brought in an average of $1,671,269 in gross revenue in 2017. ST200 honorees in the West averaged$1.79 million in sales, while the salons/spas in the South averaged $1.72 million, the Midwest $1.68 million and the Northeast $1.18 million.
• Is efficient. Th e average sales per square foot is $444 for the ST200 honorees in 2017. Higher revenue salons tend to have higher sales per square foot than lower revenue salons, but there is no statistically significant difference per region.
• Is steadily growing. Th e ST200 honorees experienced an average increase in sales of 15% from 2016 to 2017, unchanged from last year. Salons in the Northeast experienced stronger growth (21%) than salons in the South (15%), West (15%) and Midwest (12%). ST200 salons continue to show a much stronger growth rate than salons who entered that did not make the list—their growth rate was 2%.
• Is very busy. On average, the ST200 honoree rang up 20,286 transactions, with the average transaction tallying $89.50. This amount was up 8% from last year. The average price for a shampoo, cut and style was $55.60, up 4% from last year. The average price for a single-process color is $77.42, up 4% from last year. Th e average price for a basic manicure was $28.35 and for a 60-minute facial was $80.07, both are virtually unchanged from last year.
• Employs 33 team members. Th is number has declined by one employee a year for the past four years. Although there are not statistically significant differences in the number of employees per region, salons/spas grossing more than $2 million have more than two and a half times as many employees as do salons/spas that gross between$1 million and $2 million.
• Is commission based. On average, 60% of the staff of the ST200 are paid through commission.
ST200 BEHAVIOR
On average, two in three (65%) of owners of the ST200 report that they work in their businesses, performing services. Of the owners who do, they spend an average of 23 hours a week performing services—down two hours from last year. Owners of lower-revenue salons spend more time performing client services than do owners of higher-revenue salons.
As seen in past years, almost all (99%) report holding regular staff meetings—67% hold them monthly, while 17% meet quarterly, 11% weekly, and 5% huddle daily.
At 47%, just less than half of the ST200 honorees report having noncompete or nonsolicitation contracts in-house. Th at number has continued to grow the past two years. Among those who have noncompete/nonsolicitation contracts, 30% have defended them in court.
All of the ST200 track Key Performance Indicators (KPIs) of some kind, with the most popular being productivity, client count, percent of clients prebooked, existing client retention, new client retention and retail per client ticket. Th e preferred KPI in the South and Northeast is average ticket, while in the Midwest it’s productivity and the West prefers client count.
When asked what management areas they felt most in control of, ST200 honorees responded: retail commission, service payroll, education and training expense, and nonservice payroll including manager. They felt least in control of inventory and shrinkage, cost of service assistants/new talent and the cost of backbar and color.
During the past five years, little has changed when it comes to what keeps owners awake at night. Top concerns included their inability to reduce expenses and keeping service staff busy, followed by threat of a walkout, not understanding how to improve profitability, and ineffective salon managers. One exception: they are less concerned about their local economy and aren’t as worried about finding available financing.
The landmark, photo-based interior design competition has opened its application process. We'd love you to hit us with your best shots!

The landmark, photo-based interior design competition has opened its application process. We'd love you to hit us with your best shots!
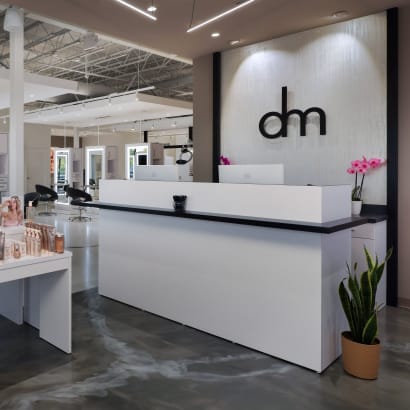
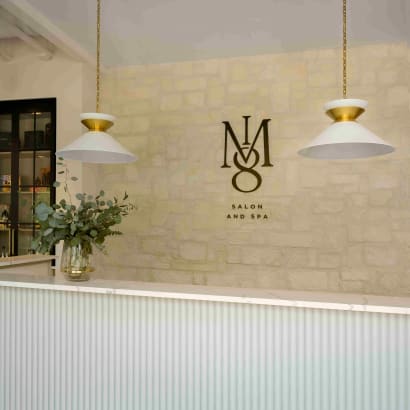
At night, Dominic Michael Salon keeps the interior lights on, as the illuminated, eye-catching contemporary design serves as a billboard that consistently attracts new guests.
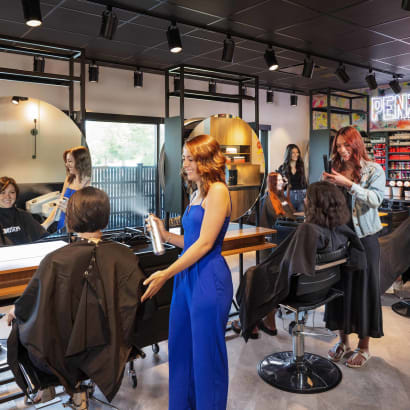
Built from the ground up, Mane 18’s design strikes a balance between an elevated experience for guests and the functionality and flow necessary for team members to perform at their best.
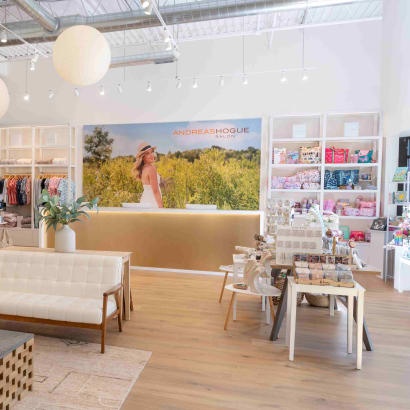
Andreas Hogue Salon’s recent renovation surprises visitors with the interior’s expansion of space, elevated retail area, and changing views of the restored Chicago prairie.

It's Day 10 of our SALON TODAY 200 reveals, and we've reached the end! Today, we toast the honorees in the second half of growth--the salons, spas, and barbershops that constantly strive to build stronger bottom lines, including Brandy Smith Stephens in Baton Rouge, Louisiana.

On Day 9 of our 2026 SALON TODAY 200 reveals, a big 'Huzzah' to our first look at the salons, spas and barbershops that fueled their growth by mastering a number of best practices, including the fun team from Lavish Hair Lounge in Albuquerque, New Mexico. (P.S. The second half of Growth comes tomorrow.)
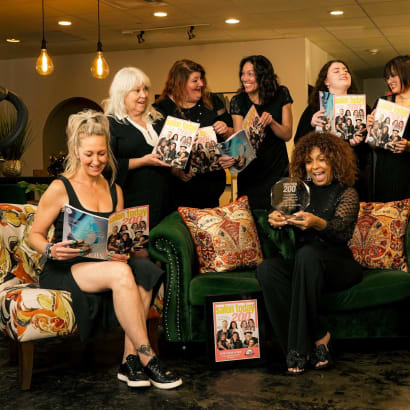
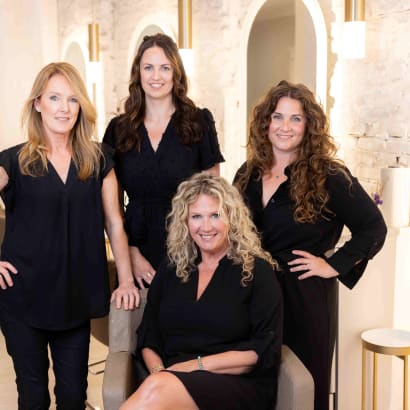
A big "Bravo!" to the salons and spas that develop strong cultures that fuel growth while retaining team members, such as Soleil Salon & Spa team in Windham, New Hampshire, who catch up reading last year's 200 issue.
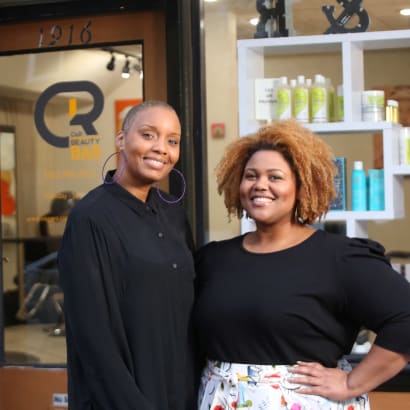
We tip our hats to the salons and spas that genuinely connect with guests and strive to elevate their service, including Chenica Racine and Ricka O'Bannon, owners of C&R Beauty Bar in Louisville, Kentucky.

Hats off to the 2026 SALON TODAY 200 honorees who make education a priority for employees at every level, including Eric Fisher Salon, which hosted Educator Oscar Bond for a cutting class in Wichita, Kansas.

Today, we have two 2026 SALON TODAY 200 categories as we hail the salons that find creative ways to build client loyalty and the ones that constantly explore and embrace new technology to further their businesses, including the social-savvy team from Verde Salon Group in Winnipeg, Manitoba.
For today's SALON TODAY 200 announcements, we toast the honorees who prioritize the environment in their business decisions and those who take retail to the next level, including the excited team from Pure Salon Spa in Louisville, Kentucky.

Cheers to the SALON TODAY 200 honorees who give their time, talent and fundraising efforts to their communities, including Eli Mancha and the team from Bang! Salon, whose cut-a-thon has collected more than 1,200 coats that have been donated to Chicago's unhoused.
It's Day 1 of our 2026 SALON TODAY 200 announcements, and today, we raise our glasses for the honorees in the Business Builders category. These salons, including Elan Hair Studio in Spring Lake, New Jersey, took strategic risks that paid off in revenue-generating success.
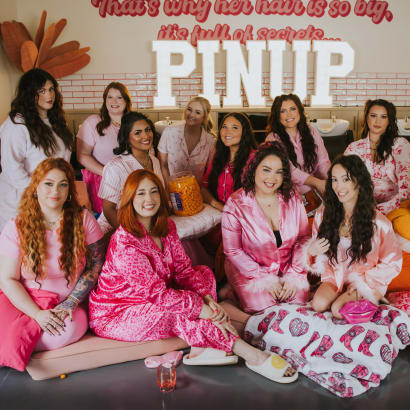
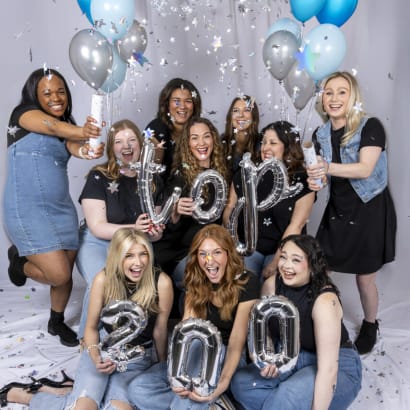
It's time to celebrate the 2026 SALON TODAY 200 honorees who design rewarding career paths and seek out enriching benefits to keep their team members healthy, happy and growing, including the team from Pinup Studio in Raleigh, North Carolina, who always enjoy a good pajama party.
With a training salon, treatment rooms, education and collaboration spaces, a podcast studio and a yoga studio, BASE ONE is the foundation for the future growth of PENZONE Salons+Spas, as well as the company's gift to their community and the industry. Peruse the image gallery or take the personalized video tour led by Debra Penzone to see this exceptional space.
As our judges read those last essays and create their list of honorees in each category, we're planning to start announce the 2026 SALON TODAY 200 starting February 25.